You must be signed in to read the rest of this article.
Registration on CDEWorld is free. You may also login to CDEWorld with your DentalAegis.com account.
With respect to treatment of caries, the tendency is to treat caries lesions therapeutically much earlier than at the cavitated stage. Incorporating caries management by risk assessment (CAMBRA)1-7 into their daily dental office routine enables clinicians to identify a patient’s caries risk by evaluating his or her disease indicators, risk factors, and preventive factors. After careful evaluation, a classification of low, moderate, high, or extremely high caries risk can be made, and preventive chemical measures, as well as any changes in lifestyle, can be suggested. In the case of a patient with moderate or high caries risk, the goal is to reduce the risk level and prevent further caries. Already-cavitated lesions, of course, require traditional invasive restorative treatment. In contrast, precavitated caries lesions—where demineralization of enamel has occurred but an intact mineral surface layer still exists—can be treated with remineralization efforts. Remineralization can be achieved directly by providing various levels of fluoride treatment (prescription fluoride toothpaste, fluoride rinse, fluoride varnishes) or indirectly by enhancing saliva flow (xylitol mints/gums) or through bacteria reduction (chlorhexidine applications, xylitol mints/gums).
In order to easily apply the CAMBRA principles outlined above, it is useful to introduce state-of-the-art, sensitive caries diagnostic tools into the dental office armamentarium. Caries detection has traditionally been performed with a visual examination plus the use of an explorer to provide additional tactile information. European studies have demonstrated that the information thought to come from the explorer was correct in fewer than 50% of cases.8 Radiographs—specifically bitewings—have also been engaged to detect caries lesions, but they work satisfactorily only for approximal lesions. Due to the beam attenuation from healthy enamel and dentin when trying to detect occlusal lesions on radiographs, occlusal lesions can be detected only at a very advanced stage.9
If carious lesions are detected early enough in a precavitated stage, intervention methods such as fluoride application, sealants, preventive resin restorations, laser treatment, and antibacterial therapy can be applied to reverse the caries process.9 Sensitive modern caries diagnostic tools can serve not only for early detection but also for monitoring caries lesions to confirm the success of prevention and remineralization efforts.
This article describes light-based caries diagnostic tools that are either available for the dental office or are still in the laboratory research stage. The most commonly available tools—some of which have been successfully marketed—are compared with a standardized visual caries inspection system. The International Caries Detection and Assessment System (ICDAS II) was designed and adopted to avoid inconsistencies between diagnoses from different dentists.10
Light-Based Caries Detection Methods
Fiber-Optic Transillumination
Novel early caries detection methods include fiber-optic transillumination (FOTI). This technique, which has been available for more than 40 years, uses light transmission through the tooth.11-13 A recently marketed method based upon the same principles is the digitized fiber-optic transillumination (DIFOTI) method. Acquired images can be stored for subsequent retrieval and comparative examination. Only limited research has been performed so far, but the results have indicated that the technique is grossly inadequate at quantitatively determining lesion depth or extent.14-16 The technique essentially measures surface scattering on the outside of the lesion, rather than demineralization in the depth of the enamel.
Optical Coherence Tomography
Optical coherence tomography (OCT) is a non-ionizing imaging technique that can produce cross-section images of biologic tissues.17-20 When a tooth with a carious lesion is illuminated with infrared light at 1,310 nm, OCT technology can produce 2- or 3-dimensional images as well as a quantitative image of the subsurface lesion to the full depth of the enamel.21,22 Polarized sensitive OCT (PS-OCT) can be correlated with the degree of demineralization and lesion severity.21,23 Potential future use for OCT could be monitoring in-vivo caries lesion changes as well as detecting demineralization beyond sealants.24
Fluorescence Caries Diagnostic Tools
The following diagnostic tools are based on the phenomenon of fluorescence. Fluorescence is a property of natural and some man-made materials that absorb energy at certain wavelengths and then emit light at longer wavelengths. Several caries detection methods engage the use of fluorescence.
DIAGNOdent—Enamel is essentially transparent under red light. When a caries lesion is illuminated with, for instance, red laser light (655 nm), organic molecules that have penetrated porous regions of the tooth—especially metabolites from oral bacteria—will create an infrared (IR) fluorescence. The IR fluorescence is believed to originate from porphyrins and related compounds from oral bacteria.25-28
In the case of the DIAGNOdent tool (KaVo Dental, www.kavousa.com), the emitted light is channeled through the handpiece to a detector, and a digital number (1-99) and a sound is presented to the operator. A higher number indicates more fluorescence and a more extensive lesion below the surface; a value of 5 to 10 indicates initial caries in enamel, 10 to 20 denotes initial caries in dentin, and > 20 signifies caries in dentin. The system has shown good performance and reproducibility for detection and quantification of occlusal and smooth-surface carious lesions in in-vitro studies.25,29 In vivo, the results are more contradictory, both in the primary and permanent dentition.30-36 DIAGNOdent has also been tried for longitudinal monitoring of the caries process and for assessing the outcome of preventive interventions.37 As reported in various papers, the sensitivity of the system ranges between 19% and 100%, with a specificity between 52% and 100%.38 (Note: Sensitivity means that the test correctly indicates when a person, in fact, has the disease; while specificity means that the test indicates that a person without the disease is, in fact, disease-free.)
Quantitative Light-Induced Fluorescence—It has been suggested that tooth autofluorescence and its attenuation is useful for the detection of dental caries.39 The reasoning behind this theory is that increased porosity due to a subsurface enamel lesion, which is occupied by water, scatters the light either as it enters the tooth or as the fluorescence is emitted. This scattering results in a loss of its natural fluorescence. As a result, on a digital image the demineralized area appears opaque and darker than sound enamel. Inspektor™ Pro (Inspektor Dental Care, www.inspektordentalcare.com), a QLF method on the market in several countries, can detect lesions to a depth of approximately 500 µm on smooth enamel surfaces. QLF uses a 370-nm excitation wavelength, resulting in a green autofluorescence of the tooth. The QLF method has been tested in several in-vitro,40-42 in-situ,43 and in-vivo44-49 studies for smooth-surface caries lesions. Adapting the QLF method for occlusal caries diagnosis is under investigation.50 The sensitivity of the system is reported to be 80% to 96%, with a specificity of 11% to 80%.51,52
Spectra® Caries Detection Aid System—This system (Air Techniques, Inc., www.airtechniques.com) aids in the detection of caries using fluorescence technology light-emitting diodes (LEDs), which project high-energy light at an excitation wavelength of 405 nm onto the tooth surface. Cariogenic bacteria fluoresce red, and healthy enamel fluoresces green. The on-screen picture of the tooth includes false coloring and a number scale predicting the caries depth, with 1.0 to 1.5 as early enamel caries, 1.5 to 2.0 as deep enamel caries, 2.0 to 2.5 as dentin caries, and 2.5 or above as deep dentin caries. The sensitivity of the system is reported to be 71% to 86%, with a specificity of 32% to 76%.53,54
SOPROLIFE System—This system (Acteon Imaging, www.acteongroup.com) is said to combine the advantages of a visual inspection method (high specificity) with a high-magnification oral camera and a laser fluorescence device (high reproducibility and discrimination). This technique is based on the light-induced fluorescence evaluator for diagnosis and treatment (LIFEDT) concept.55,56 In the “daylight mode,” white LEDs illuminate the tooth, while in the “fluorescence mode,” the excitation is managed by four blue LEDs at a 450-nm wavelength. The intense blue light shines through the enamel and induces a green fluorescence from the dentin core, which, on its way back through dentin/enamel, consequently initiates a red fluorescence due to porphyrins and related compounds from oral bacteria remaining at a caries lesion site.57
In order to classify caries lesions in early stages using the SOPROLIFE tool, the authors have introduced a new scale. SOPROLIFE daylight and SOPROLIFE fluorescence pictures for occlusal fissure areas were each categorized into six different groups—code 0 to code 5.57 The categorization followed appearance criteria of the lesion and was performed independently from a parallel registered ICDAS II code. The categorization was based on the idea that the width of a lesion was related to the confines of fissures, difference in color and intensity of the registered color expressions, as well as the roughness of the enamel structure and the break in enamel with first enamel loss, and, finally, that visible dentin would coincide with the progression of a caries lesion. Thus, precavitated and cavitated lesions and their development levels were categorized.
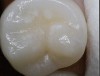
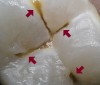
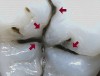
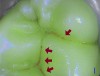
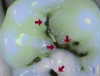
Daylight mode codes for coronal caries using SOPROLIFE, along with observed tooth changes, are depicted and summarized in Figure 1 through Figure 6. When evaluating occlusal fissure areas with SOPROLIFE, daylight mode code 0 is given for sound enamel with no changes in the fissure area (Figure 1). Code 1 is applied if the center of the fissure shows whitish or slightly yellowish change in the enamel. In code 1, change is limited to part or all of the base of the pit and fissure system (Figure 2). In code 2, the whitish change is wider and extends to the base of the pit and fissure system and comes up the slopes (walls) of the fissure system in the direction of the cusps. The whitish change can be seen in part or all of the pit and fissure system, but no enamel breakdown is visible (Figure 3). In code 3, fissure areas are rough and slightly open, depicting a beginning slight enamel breakdown. Changes are confined to the fissure and do not need to come up the slopes. There are no visual signs of dentin involvement (Figure 4). In code 4, the caries process is no longer confined to the fissure width and presents itself as much wider than the fissure; the changed areas have a “mother-of-pearl” glossy appearance (Figure 5). If there is obvious enamel breakdown with visible dentin, code 5 is given (Figure 6).
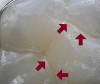
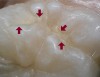
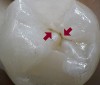
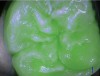
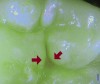
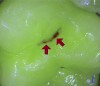
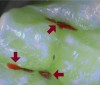
Blue fluorescence mode codes for coronal caries using SOPROLIFE, along with observed tooth changes, are depicted and summarized in Figure 7 through Figure 12. SOPROLIFE blue fluorescence mode code 0 is given when the fissure appears shiny green and the enamel appears sound with no visible changes (Figure 7); rarely, a graphite pencil-colored thin shine/line can be observed. Code 1 is selected if a tiny, thin red shimmer in the pit and fissure system is observed, which can slightly come up the slopes of the fissure system. No red dots are visible (Figure 8). At code 2, in addition to the tiny, thin red shimmer in pits and fissures possibly coming up the slopes, darker red spots confined to the fissure are visible (Figure 9). For code 3, dark red spots extend as lines into the fissure areas, but are still confined to the fissures. A slight beginning roughness of the deepened red-lined areas might be observed (Figure 10). If the dark red (or red-orange) extends wider than the confines of the fissures, a code 4 is given (Figure 11). Surface roughness occurs, and possibly grey and/or rough grey zones are visible. Code 5 is selected if obvious openings of enamel are seen with visible dentin (Figure 12).
Comparing Diagnostic Capabilities of Fluorescence Tools
Until now, all available caries diagnostic tools have had limitations due to low sensitivity, specificity, or usefulness. The authors conducted a study of 100 subjects to evaluate the diagnostic capabilities of three successfully marketed caries lesion detection tools—a laser fluorescence tool (DIAGNOdent) and two LED fluorescence tools (Spectra Caries Detection Aid system and SOPROLIFE daylight and blue florescence tool)—plus a QLF tool, which is used mainly for research. The tools were compared to the ICDAS II for detection of caries lesions.
ICDAS II provides a standardized method of lesion detection and assessment, leading to caries diagnosis. It assigns scores to lesions based on apparent caries status and lesion severity of plaque-free teeth.10 Due to the validated relationship between ICDAS II codes and the histological depth of a carious lesion, ICDAS II was used as the “gold standard” in the present study.31,32,58,59
The study subjects (58 females, 42 males, average age 23.4 ± 10.6 years) presented 433 occlusal, unfilled surfaces of posterior teeth (90 bicuspids, 343 molars). On each tooth, up to five fissure areas were separately evaluated; thus with each system, up to 1,066 areas of interest were evaluated and scored.
Two examiners independently evaluated ICDAS II scores. The inter-examiner reliability for the ICDAS II scoring was assessed with a kappa = 0.884; the agreement was considered to be “very good.”60 In addition, 110 fissure areas were scored as sound (code 0). ICDAS II code 1—mineral loss in the base of a fissure—was given for 450 spots; and code 2—mineral loss extended from the base—for 314 lesions, presenting a total of 764 precavitated lesions. Early cavitation with first visual enamel breakdown—ICDAS II code 3—was diagnosed in 107 cases; more progressed carious lesions with code 4 as well as code 5 were each noted 26 times.
In the majority of these pit and fissure areas (424), DIAGNOdent values between 0 and 10 were recorded, followed by 291 spots with values between 11 and 20. The remaining 326 measurements showed values between 21 and 99, including 31 areas with a DIAGNOdent value of 99.
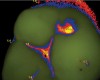
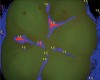
A Spectra Visix™ (Air Techniques, Inc.) value of 0 (no value depicted by the Spectra System) was observed 114 times. Values between 1.0 and 1.9 were displayed 739 times, a value of 2.0 to 2.9 was registered 172 times, and a value between 3.0 and 3.9 was shown 14 times, with 3.9 as the highest value measured. Figure 13 shows on-screen false colors and numbers for a tooth clinically presenting obvious caries lesions (ICDAS II code 5), while the tooth in Figure 14 clinically shows some beginning demineralization of the fissure system (ICDAS II code 1).
Using the newly developed scoring system, 1,066 SOPROLIFE daylight mode scores were assigned to the occlusal surfaces of the 433 study teeth; 142 pit and fissure areas were scored as code 0, 436 as code 1, 165 as code 2, 138 as code 3, 96 as code 4, and 89 as code 5. In addition, using the SOPROLIFE fluorescence mode, the two independent examiners assigned code 0 242 times; code 1, 263 times; code 2, 224 times; code 3, 133 times; code 4, 121 times; and code 5, 81 times.
Finally, QLF mineral loss values could be evaluated on 988 sites, with 353 sites showing a mineral loss of less than 10%, 463 sites between 10% and 20%, 131 sites between 20% and 30%, and 42 sites between 30% and 67%.
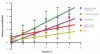
Linear Regression Fits for Tools in Relation to ICDAS II Scores
Examining the relationship between the ICDAS II scores and the scores derived from the different assessment tools revealed that for each ICDAS II code, each diagnostic tool provided a distinct average score. To evaluate the ability to discriminate between two different scores for each assessment method, linear regression curves were calculated for each tool. The steeper the regression curve, the higher the ability of a tool to discriminate between two values and the more useful the tool is in clinics.
The graph in Figure 15 combines the linear regression fit for the five different assessment tools—DIAGNOdent, SOPROLIFE daylight and blue fluorescence, Spectra Caries Detection Aid, and QLF—in relation to the ICDAS II scores. (Note that to produce this overview, it was necessary for data to be normalized to achieve a y-axis value range between 0 and 5; DIAGNOdent and QLF values adjustment factor 0.05x.) Using normalized data, the slopes of the regression lines for all tools are significantly non-zero, indicating that differences between each score actually exist. The slopes of the regression lines are the steepest for both SOPROLIFE assessment methods (0.88), followed by DIAGNOdent (0.66). The steepness of the Spectra Caries Detection Aid line is relatively flat (0.34), while the QLF tool depicts the flattest incline (0.25). Extrapolating from these data, when using SOPROLIFE, a judgment call for classification of a lesion into sound, precavitated, or cavitated—even with sublevels per class—is easier to make than with the other tools.
DIAGNOdent as a spot fluorescence measurement tool has been previously discussed for its clinical validity,30-34,36,61 but an appropriate cut-off point to determine an operative intervention (filling) is under discussion.62-66 The manufacturer recommends a cut-off point between 15 and 30, depending on caries risk. Eakle et al recommended a DIAGNOdent value of 25 to 30 as the cut-off point.67 If an ICDAS II code 3—the first visualized breakdown of enamel—is considered to be a reason for an operative intervention, according to the present study, the equivalent DIAGNOdent value would be approximately 40, while for code 2 it would be approximately 22.
The SOPROLIFE daylight average score of 0.47 for the ICDAS II code 0 (healthy enamel) was adequately low. Noncavitated lesions (ICDAS II code 1 and code 2) provided significantly higher SOPROLIFE daylight scores of 1.4 and 2.1, respectively. More severe caries lesions, with first visible enamel breakdown (ICDAS II code 3), again presented significantly higher scores of 3.5. When dentin was already visibly exposed (ICDAS II code 5), the SOPROLIFE daylight score climbed to an average 4.9. For SOPROLIFE blue fluorescence, the distribution pattern, as well as the values for average scores, were similar and close to the SOPROLIFE daylight assessments. The absolute value differences between those average scores are high enough to support the conclusion that the difference between each code is not only statistically but also clinically significant. Thus, the new SOPROLIFE daylight and blue fluorescence codes can serve as a distinct classification for sound, precavitated, and cavitated caries lesions, enabling the prediction of the histological depth of caries lesions.
Lastly, when comparing average Spectra Visix and QLF values for each ICDAS II code, the differences in values for each code are statistically significant, but the absolute value differences are relatively small. Those small differences in value for each lesion class might not be clinically significant enough to help in differentiating between sound, precavitated, or cavitated lesions.
Conclusion
When comparing spot-measuring fluorescence tools with those providing high-resolution fluorescence pictures, the better visibility provided by the high-resolution tools might help prevent unnecessary operative interventions that are based solely on high fluorescence scores. A fluorescence camera system can produce a visible depiction of the source of the fluorescence signal as well as help determine the reason for an unexpected high fluorescence value. Having better “visibility” of the lesion makes it easier to interpret the higher fluorescence. The observation capacity of such a system can guide clinicians towards a more preventive and minimally invasive treatment strategy in the course of monitoring lesion progression or remineralization over time, and it should deter them from restoratively over-treating a lesion.68
Disclosure
The authors declare that there is no conflict of interest regarding this manuscript. The research presented has been financially supported by a grant from Acteon, France, through the Contracts & Grants Division at the University of California at San Francisco, representing the Regents of the University of California.
References
1. Young DA, Featherstone JD, Roth JR. Curing the silent epidemic: caries management in the 21st century and beyond. J Calif Dent Assoc. 2007;35(10):681-685.
2. Young DA, Featherstone JD, Roth JR, et al. Caries management by risk assessment: implementation guidelines. J Calif Dent Assoc. 2007;35(11):799-805.
3. Jenson L, Budenz AW, Featherstone JD, et al. Clinical protocols for caries management by risk assessment. J Calif Dent Assoc. 2007;35 (10):714-723.
4. Doméjean-Orliaguet S, Gansky SA, Featherstone JD. Caries risk assessment in an educational environment. J Dent Educ. 2006;70(12):1346-1354.
5. Featherstone JD, Gansky SA, Hoover CI, et al. Chlorehexidine and fluoride therapy reduces caries risk [Abstract]. J Dent Res. 2005;84(spec iss A). Abstract 0023.
6. Hoover CI, Weintraub JA, Gansky SA, et al. Effect of a caries management regimen on cariogenic bacterial population [Abstract]. J Dent Res. 2004;83(spec iss A). Abstract 0779.
7. Featherstone JD. The caries balance: the basis for caries management by risk assessment. Oral Health Prev Dent. 2004;2 Suppl 1:259-264.
8. Lussi A. Validity of diagnostic and treatment decisions of fissure caries. Caries Res. 1991;25(4):296-303.
9. Featherstone JD. Caries detection and prevention with laser energy. Dent Clin North Am. 2000;44(4):955-969.
10. ICDAS Foundation. International Caries Detection & Assessment System. www.icdas.org. Accessed June 27, 2012.
11. Mitropoulos CM. The use of fibre-optic transillumination in the diagnosis of posterior approximal caries in clinical trials. Caries Res. 1985;19(4):379-384.
12. Deery C, Care R, Chesters R, et al. Prevalence of dental caries in Latvian 11- to 15-year-old children and the enhanced diagnostic yield of temporary tooth separation, FOTI and electronic caries measurement. Caries Res. 2000;34(1):2-7.
13. Côrtes DF, Ellwood RP, Ekstrand KR. An in vitro comparison of a combined FOTI/visual examination of occlusal caries with other caries diagnostic methods and the effect of stain on their diagnostic performance. Caries Res. 2003;37(1):8-16.
14. Young DA, Featherstone JD. Digital imaging fiber-optic trans-illumination, F-speed radiographic film and depth of approximal lesions. J Am Dent Assoc. 2005;136(12):1682-1687.
15. Vaarkamp J, Ten Bosch JJ, Verdonschot EH, Tranaeus S. Quantitative diagnosis of small approximal caries lesions utilizing wavelength-dependent fiber-optic transillumination. J Dent Res. 1997;76(4):875-882.
16. Schneiderman A, Elbaum M, Shultz T, et al. Assessment of dental caries with Digital Imaging Fiber-Optic TransIllumination (DIFOTI): in vitro study. Caries Res. 1997;31(2):103-110.
17. Huang D, Swanson EA, Lin CP, et al. Optical coherence tomography. Science. 1991;254(5035):1178-1181.
18. Fercher AF, Hitzenberger CK, Drexler W, et al. In vivo optical coherence tomography. Am J Ophthalmol. 1993;116(1):113-114.
19. Tearney GJ, Brezinski ME, Bouma BE, et al. In vivo endoscopic optical biopsy with optical coherence tomography. Science. 1997;276(5321):2037-2039.
20. Fujimoto JG, Boppart SA, Tearney GJ, et al. High resolution in vivo intra-arterial imaging with optical coherence tomography. Heart. 1999;82(2):128-133.
21. Fried D, Xie J, Shafi S, et al. Imaging caries lesions and lesion progression with polarization sensitive optical coherence tomography. J Biomed Opt. 2002;7(4):618-627.
22. Jones RS, Darling CL, Featherstone JD, Fried D. Imaging artificial caries on the occlusal surfaces with polarization-sensitive optical coherence tomography. Caries Res. 2006;40(2):81-89.
23. Jones RS, Darling CL, Featherstone JD, Fried D. Remineralization of in vitro dental caries assessed with polarization-sensitive optical coherence tomography. J Biomed Opt. 2006;11(1):014016.
24. Jones RS, Staninec M, Fried D. Imaging artificial caries under composite sealants and restorations. J Biomed Opt. 2004;9(6):1297-1304.
25. Lussi A, Imwinkelried S, Pitts N, et al. Performance and reproducibility of a laser fluorescence system for detection of occlusal caries in vitro. Caries Res. 1999;33(4):261-266.
26. Lussi A, Hibst R, Paulus R. DIAGNOdent: an optical method for caries detection. J Dent Res. 2004;83 Spec No C:C80-83.
27. Verdonschot EH, van der Veen MH. [Lasers in dentistry 2. Diagnosis of dental caries with lasers]. Ned Tijdschr Tandheelkd. 2002;109(4):122-126.
28. König K, Flemming G, Hibst R. Laser-induced autofluorescence spectroscopy of dental caries. Cell Mol Biol (Noisy-le-grand). 1998;44(8):1293-1300.
29. Shi XQ, Welander U, Angmar-Månsson B. Occlusal caries detection with KaVo DIAGNOdent and radiography: an in vitro comparison. Caries Res. 2000;34(2):151-158.
30. Rocha RO, Ardenghi TM, Oliveira LB, et al. In vivo effectiveness of laser fluorescence compared to visual inspection and radiography for the detection of occlusal caries in primary teeth. Caries Res. 2003;37(6):437-441.
31. Astvaldsdottir A, Holbrook WP, Tranaeus S. Consistency of DIAGNOdent instruments for clinical assessment of fissure caries. Acta Odontol Scand. 2004;62(4):193-198.
32. Tranaeus S, Lindgren LE, Karlsson L, Angmar-Månsson B. In vivo validity and reliability of IR fluorescence measurements for caries detection and quantification. Swed Dent J. 2004;28(4):173-182.
33. Bamzahim M, Aljehani A, Shi XQ. Clinical performance of DIAGNOdent in the detection of secondary carious lesions. Acta Odontol Scand. 2005;63(1):26-30.
34. Angnes G, Angnes V, Grande RH, et al. Occlusal caries diagnosis in permanent teeth: an in vitro study. Braz Oral Res. 2005;19(4):243-248.
35. Reis A, Loguercio AD. A 24-month follow-up of flowable resin composite as an intermediate layer in non-carious cervical lesions. Oper Dent. 2006;31(5):523-529.
36. Akarsu S, Köprülü H. In vivo comparison of the efficacy of DIAGNOdent by visual inspection and radiographic diagnostic techniques in the diagnosis of occlusal caries. J Clin Dent. 2006;17(3):53-58.
37. Altenburger MJ, Gmeiner B, Hellwig E, et al. The evaluation of fluorescence changes after application of casein phosphopeptides (CPP) and amorphous calcium phosphate (ACP) on early carious lesions. Am J Dent. 2010;23(4):188-192.
38. Bader JD, Shugars DA. A systematic review of the performance of a laser fluorescence device for detecting caries. J Am Dent Assoc. 2004;135(10):1413-1426.
39. Benedict HC. A note on the fluorescence of teeth in ultra-violet rays. Science. 1928;67(1739):442.
40. Hafström-Björkman U, Sundström F, de Josselin de Jong E, et al. Comparison of laser fluorescence and longitudinal microradiography for quantitative assessment of in vitro enamel caries. Caries Res. 1992;26(4):241-247.
41. Emami Z, al-Khateeb S, de Josselin de Jong E, Sundstrom F, et al. Mineral loss in incipient caries lesions quantified with laser fluorescence and longitudinal microradiography. A methodologic study. Acta Odontol Scand. 1996;54(1):8-13.
42. al-Khateeb S, ten Cate JM, Angmar-Månsson B, et al. Quantification of formation and remineralization of artificial enamel lesions with a new portable fluorescence device. Adv Dent Res. 1997;11(4):502-506.
43. al-Khateeb S, Oliveby A, de Josselin de Jong E, Angmar-Månsson B. Laser fluorescence quantification of remineralisation in situ of incipient enamel lesions: influence of fluoride supplements. Caries Res. 1997;31(2):132-140.
44. de Josselin de Jong E, Sundström F, Westerling H, et al. A new method for in vivo quantification of changes in initial enamel caries with laser fluorescence. Caries Res. 1995;29(1):2-7.
45. al-Khateeb S, Forsberg CM, de Josselin de Jong E, Angmar-Månsson B. A longitudinal laser fluorescence study of white spot lesions in orthodontic patients. Am J Orthod Dentofacial Orthop. 1998;113(6):595-602.
46. Tranaeus S, al-Khateeb S, Björkman S, et al. Application of quantitative light-induced fluorescence to monitor incipient lesions in caries-active children. A comparative study of remineralisation by fluoride varnish and professional cleaning. Eur J Oral Sci. 2001;109(2):71-75.
47. Tranaeus S, Shi XQ, Lindgren LE, et al. In vivo repeatability and reproducibility of the quantitative light-induced fluorescence method. Caries Res. 2002;36(1):3-9.
48. Pretty IA, Ellwood RP. Comparison of paired visual assessment and software analyses of changes in caries status over 6 months from fluorescence images. Caries Res. 2007;41(2):115-120.
49. Yin W, Feng Y, Hu D, et al. Reliability of quantitative laser fluorescence analysis of smooth surface lesions adjacent to the gingival tissues. Caries Res. 2007;41(3):186-189.
50. Ferreira Zandoná AG, Analoui M, Beiswanger BB, et al. An in vitro comparison between laser fluorescence and visual examination for detection of demineralization in occlusal pits and fissures. Caries Res. 1998;32(3):210-218.
51. Stookey GK. Quantitative light fluorescence: a technology for early monitoring of the caries process. Dent Clin North Am. 2005;49(4):753-770.
52. Kühnisch J, Ifland S, Tranaeus S, et al. Establishing quantitative light-induced fluorescence cut-offs for the detection of occlusal dentine lesions. Eur J Oral Sci. 2006;114(6):483-488.
53. Rodrigues JA, Hug I, Diniz MB, Lussi A. Performance of fluorescence methods, radiographic examination and ICDAS II on occlusal surfaces in vitro. Caries Res. 2008;42(4):297-304.
54. Jablonski-Momeni A, Schipper HM, Rosen SM, et al. Performance of a fluorescence camera for detection of occlusal caries in vitro. Odontology. 2011;99(1):55-61.
55. Terrer E, Koubi S, Dionne A, et al. A new concept in restorative dentistry: light-induced fluorescence evaluator for diagnosis and treatment. Part 1: Diagnosis and treatment of initial occlusal caries. J Contemp Dent Pract. 2009;10(6):E086-094.
56. Terrer E, Raskin A, Koubi S, et al. A new concept in restorative dentistry: LIFEDT-light-induced fluorescence evaluator for diagnosis and treatment: part 2 - treatment of dentinal caries. J Contemp Dent Pract. 2010;11(1):E095-102.
57. Rechmann P, Charland D, Rechmann BM, Featherstone JD. Performance of laser fluorescence devices and visual examination for the detection of occlusal caries in permanent molars. J Biomed Opt. 2012;17(3):036006.
58. Ekstrand KR, Kuzmina I, Bjørndal L, Thylstrup A. Relationship between external and histologic features of progressive stages of caries in the occlusal fossa. Caries Res. 1995;29(4):243-250.
59. Ekstrand KR, Ricketts DN, Kidd EA. Reproducibility and accuracy of three methods for assessment of demineralization depth of the occlusal surface: an in vitro examination. Caries Res. 1997;31(3):224-231.
60. GraphPad. Quantify Agreement with Kappa - Assess how well two observers classify subjects into groups. In: Kappa QAw, ed: GraphPad Software Inc.; 2011: p. QuickCalcs Online Calculators for Scientists. http://graphpad.com.
61. Reis A, Mendes FM, Angnes V, et al. Performance of methods of occlusal caries detection in permanent teeth under clinical and laboratory conditions. J Dent. 2006;34(2):89-96.
62. Jablonski-Momeni A, Ricketts DN, Rolfsen S, et al. Performance of laser fluorescence at tooth surface and histological section. Lasers Med Sci. 2011;26(2):171-178.
63. Goel A, Chawla HS, Gauba K, Goyal A. Comparison of validity of DIAGNOdent with conventional methods for detection of occlusal caries in primary molars using the histological gold standard: an in vivo study. J Indian Soc Pedod Prev Dent. 2009;27(4):227-234.
64. Zhang W, McGrath C, Lo EC. A comparison of root caries diagnosis based on visual-tactile criteria and DIAGNOdent in vivo. J Dent. 2009;37(7):509-513.
65. Huth KC, Neuhaus KW, Gygax M, et al. Clinical performance of a new laser fluorescence device for detection of occlusal caries lesions in permanent molars. J Dent. 2008;36(12):1033-1040.
66. Anttonen V, Seppä L, Hausen H. Clinical study of the use of the laser fluorescence device DIAGNOdent for detection of occlusal caries in children. Caries Res. 2003;37(1):17-23.
67. Eakle S, Gansky S, Zhan L, Featherstone JD. Clinical evaluation of the Diagnodent device. In: Stookey GK, ed. Early Detection of Dental Caries. Indiana Conference 2003. Indiana: Indiana University Press; 2005.
68. Pereira AC, Eggertsson H, Martinez-Mier EA, et al. Validity of caries detection on occlusal surfaces and treatment decisions based on results from multiple caries-detection methods. Eur J Oral Sci. 2009;117(1):51-57.
About the Authors
Peter Rechmann, DDS, PhD
Department of Preventive and Restorative Dental Sciences
School of Dentistry
University of California at San Francisco
San Francisco, California
Beate M.T. Rechmann
Department of Preventive and Restorative Dental Sciences
School of Dentistry
University of California at San Francisco
San Francisco, California
John D.B. Featherstone, MSc, PhD
Department of Preventive and Restorative Dental Sciences
School of Dentistry
University of California at San Francisco
San Francisco, California